
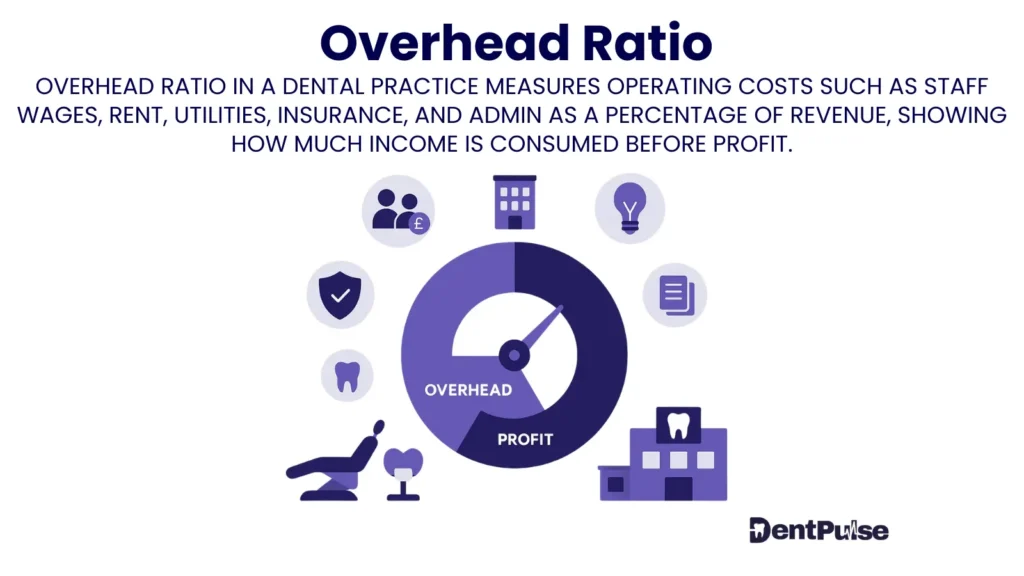
What Is the Overhead Ratio in a Dental Practice?
The Overhead Ratio is the percentage of a dental practice’s revenue that is spent on overhead costs (fixed expenses such as rent, staff, utilities, insurance, and compliance).
It shows how efficiently the practice is managing its operating base compared to income.
Why Does the Overhead Ratio Matter for Dental Practice Owners?
Revenue growth means nothing if overheads grow faster. The overhead ratio reveals whether your practice is scaling efficiently or leaking profit.
- ✅ Low ratio = lean, efficient operations
- ⚠️ High ratio = overheads eating into net profit
Example:
- Annual Revenue: £1,000,000
- Overheads: £400,000
- Overhead Ratio = 40%
If revenue grows to £1,200,000 but overheads rise to £600,000, the ratio jumps to 50% → profit margin shrinks.
How Is the Overhead Ratio Calculated?
Overhead Ratio (%)=OverheadsRevenue×100\text{Overhead Ratio (\%)} = \frac{\text{Overheads}}{\text{Revenue}} \times 100Overhead Ratio (%)=RevenueOverheads×100
- Overheads = rent, rates, non-clinical staff, utilities, compliance, technology
- Revenue = total NHS, private, and plan income
What Is a Healthy Overhead Ratio for Dental Practices?
At DentPulse, we see top-performing practices maintain overheads between 35%–45% of revenue, depending on size, stage, and location.
- 🟢 < 40% = efficient
- 🟡 40%–45% = acceptable but worth review
- 🔴 > 45% = profit at risk, investigate leaks
How Does DentPulse Track and Optimise Overhead Ratio?
| Feature | Function |
| PulseBenchmark™ | Compares your overhead ratio to similar practices |
| ProfitLeaks Radar™ | Identifies rising costs (subscriptions, utilities, compliance creep) |
| Scenario Planning | Tests impact of reducing or renegotiating overheads |
| Profit-to-Pocket™ Link | Shows how overhead ratio affects safe drawings |
DentPulse makes the overhead ratio a live efficiency measure, not just an annual calculation.
DentPulse Tip™
“A £10,000 overhead leak costs you more than a £10,000 marketing fail — because it’s permanent until fixed.”
Related Glossary Terms
- Overheads – total fixed costs of running a practice
- Fixed Expenses – predictable, recurring costs
- Net Profit Margin – profitability after overheads
- ProfitLeaks Radar™ – tool to detect hidden or rising costs
- PulseBenchmark™ – DentPulse’s comparative benchmark system
Glossary Summary Table
| Term | Meaning |
| Overhead Ratio | % of revenue spent on overheads |
| Purpose | Measures efficiency of practice operations |
| DentPulse Advantage | Live tracking, benchmarking, and leak detection |