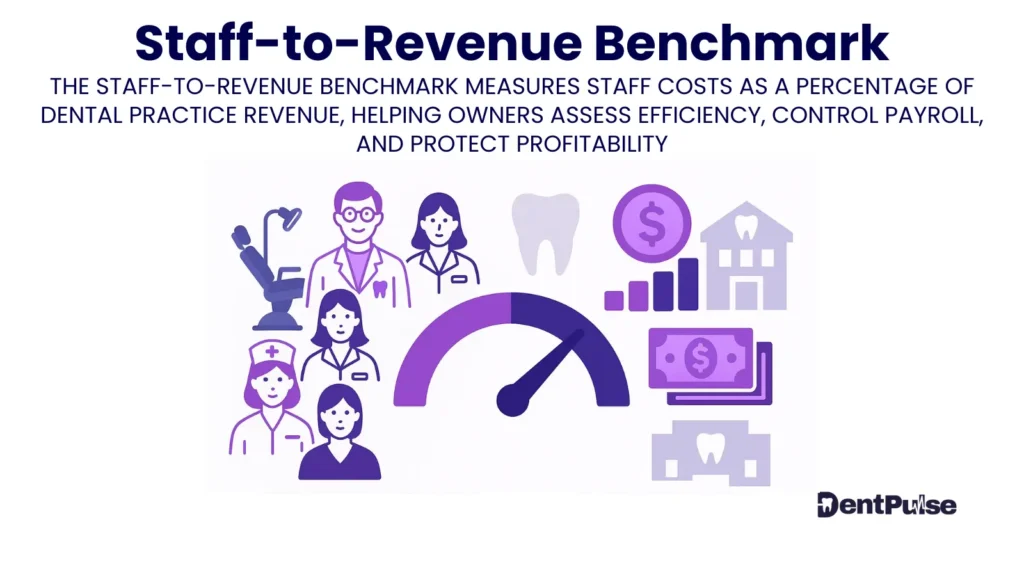
What Is the Staff-to-Revenue Benchmark in a Dental Practice?
Staff-to-Revenue Benchmark measures how much of your gross revenue is spent on employed staff wages — including:
- Front-of-house
- Nurses
- Practice managers
- Admin teams
(excluding associates and hygiene therapists, who are typically self-employed)
It tells you whether your staffing cost is in balance with your income — or if you’re overstaffed, underperforming, or growing unsustainably.
Staff costs are your largest controllable expense — and your biggest leverage point.
Why Staff-to-Revenue Benchmark Matters for Dental Practice Owners
Without a clear benchmark, many practices either:
- Over-hire based on “busy-ness,” not productivity
- Under-invest in support — burning out the clinical team
- Base decisions on gut feel, not financial precision
Getting it wrong leads to:
- Weak net profit
- High stress and turnover
- Missed opportunities to optimise the chair or diary
Example:
- Practice revenue = £950,000
- Employed staff wages = £190,000
→ Staff-to-Revenue Ratio = 20%
This is within the DentPulse healthy range — but a dip in revenue, or untracked admin creep, could shift that to 23–25% fast.
What’s a Healthy Staff-to-Revenue Benchmark?
| Zone | Ratio | Meaning |
| 🟢 Green | 16–20% | Efficiently staffed — aligned with top-performing practices |
| 🟡 Amber | 21–24% | Caution — review roles, output, and task duplication |
| 🔴 Red | 25%+ | At-risk — likely overstaffed or underperforming team ROI |
At DentPulse, high-performing clients consistently stay within 16–20% — even in mixed or complex setups.
How DentPulse Tracks and Optimises Staff-to-Revenue Ratio
| Feature | Function |
| PulseBenchmark™ Zones | Auto-categorises your practice into red/amber/green staffing health |
| Profit-to-Pocket™ Link | Shows how staff cost affects drawings and retained earnings |
| Chair Output Overlay | Connects staff support to chair utilisation |
| Task Role Mapping | Flags admin inefficiencies and nurse overloading |
| Forecast Planning Tool | Models the impact of new hires or wage changes |
DentPulse empowers practices to staff smart — not just staff more.
DentPulse Tip™
You don’t have a staff problem.
You have a visibility problem.
Once you see true ROI by role and cost per chair hour — staffing becomes a strategy, not a gamble.
Related Glossary Terms
- Chair Utilisation – Higher chair efficiency improves staff productivity
- PTP™ – Profit-to-Pocket – Tracks how team cost affects safe owner pay
- Fixed Expenses – Staff costs are core recurring outflows
- PulseBenchmark™ – Benchmarking engine that grades your profitability zone
- Lab & Materials Benchmark – Another key cost % to optimise
Glossary Summary Table
| Term | Meaning |
| Staff-to-Revenue Benchmark | The percentage of gross revenue spent on employed staff wages (excluding associates) |
| Purpose | Diagnose staffing efficiency and team profitability |
| Financial Impact | Directly impacts net margin, stress levels, and reinvestment capacity |
| DentPulse Advantage | Tracks in real time, compares against high-performer data, and links to chair and owner earnings |


